
Travel is part of how we work, and the activities we do when we travel may be linked to positive impacts on our careers. However, every flight we take and every trip we make adds to our environmental impact.
University travel is one of the largest sources of emissions mapped by ANU. In 2023, it accounted for 40 per cent of our reported carbon footprint. To minimise our impact, we need to curb our carbon emissions. That’s why we committed to reducing our travel emissions by 50 per cent by 2025 from 2019 levels. In a recent staff survey with over 400 respondents, more than three-quarters (77 per cent) said that they supported this target.
With some new ways of working that have come to stay after the pandemic, our 2023 emissions have already reduced from our 2019 levels. The staff survey showed that 97 per cent of respondents had already taken at least one action in the last year, which resulted in reduced travel emissions. The sum of these actions and others is evident in the ANU Travel Emissions Tracker, with 33 per cent less emissions in 2023 than in 2019. That is a reduction of 9,000 tonnes CO2e. Imagine the effect if we all incorporated one or two more simple actions into our travel planning. Wondering what that could be? We’ve developed some tools to help.
What can you do to travel carbon smart?
When planning our travel, we tend to consider several factors, including how much it will cost, the transit duration and how it will fit into our work schedule or personal priorities. Do you also consider the carbon footprint for the trip? Many people don’t since it’s not as readily available or verifiable as the other factors. However, the cost of those emissions is becoming more apparent each year as we see or feel the impacts of a changing climate.
Did you know that ANU frequent travellers, who on average travel the equivalent of 3.6 return flights to the UK (~23 tonnes CO2e), contribute almost five times more emissions per capita just from travel than the average global citizen from all emissions sources (4.7 tonnes CO2e)? That is also significantly higher than the emissions from all sources for the average Australian (~15 tonnes CO2e) and more than twice the average OECD member country citizen (~11 tonnes CO2e).
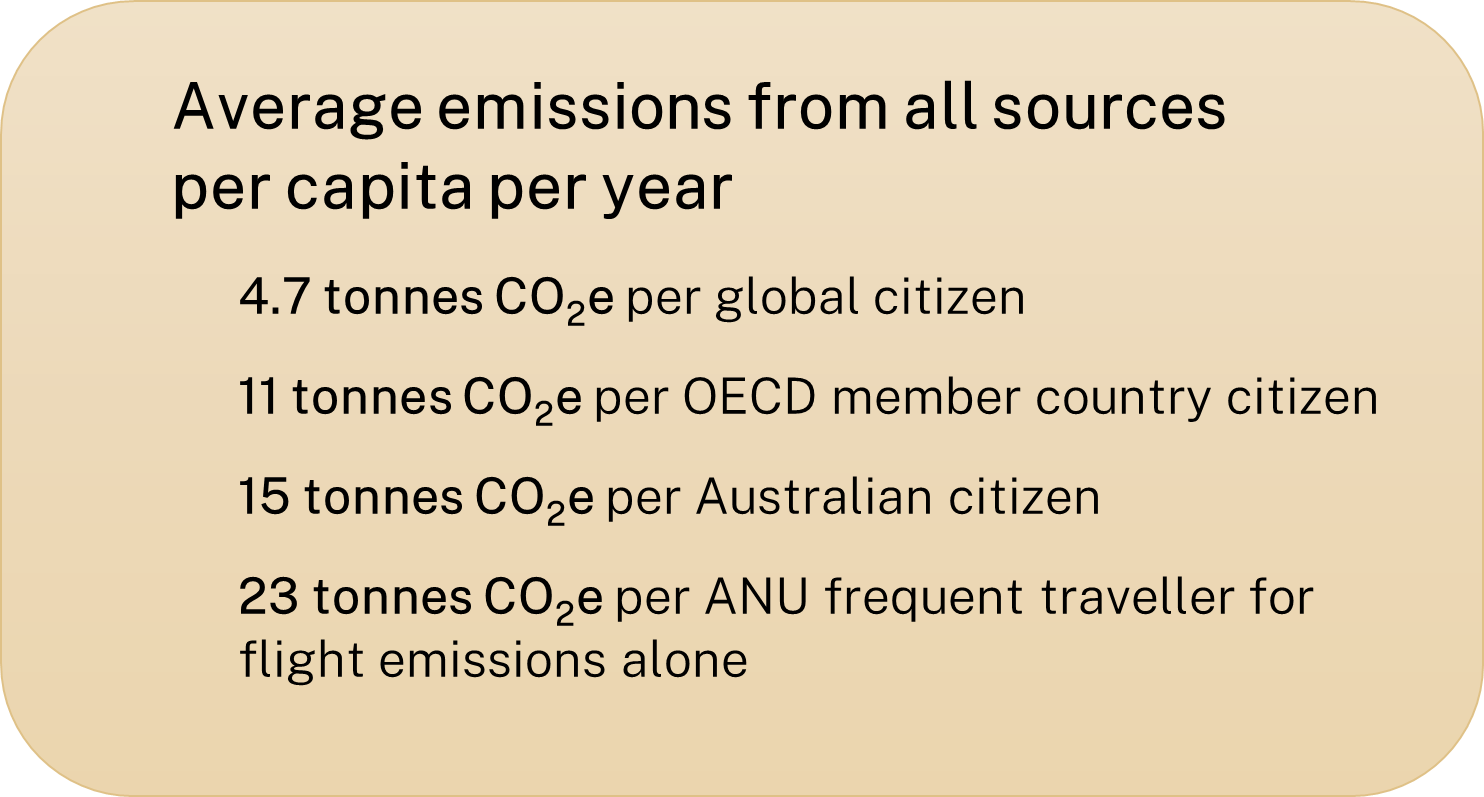
Source: ourworldindata.org
Checking the emissions for different itineraries or routes is one way to add environmental considerations to your planning. If this decision aid appeals to you, check out:
- Corporate Travel Management (CTM) – the ANU preferred booking service provides CO2 emissions data for all flights using its online booking tool. You can also sort options based on factors like emissions. To access the CTM online booking system, contact Shared Services - Travel.
- Many online booking platforms, such as Google Flights and Skyscanner, do the same and show you the comparable emissions across different options for a trip.
- ANU Below Zero quick calculation tool (Download excel file, 2.7MB) can estimate emissions for flights between airports. The methodology for calculating emissions is consistent with the Travel Emissions Tracker, which uses recommendations in the business travel section of the Greenhouse Gas Protocol, a globally acknowledged standard for measuring and managing greenhouse gas emissions.
Myth busted: Choosing low carbon flights is more expensive
Generally, itineraries with lower costs are also associated with lower emissions. A 2021 report found that low-emission flight itineraries can emit 63% less than the same route with high emission options and 22% lower than the average emissions itinerary. In most cases, the study found that "the least-emitting itinerary is relatively inexpensive, and the cheaper itineraries are likely to be lower-emitting than the average.
While this information is useful where emissions are not apparent during the booking process, this space constantly changes. We recommend using a booking service or search engine that shows emissions alongside other factors when booking to be sure of your carbon footprint.
Want to know more about our emissions profiles? Explore the ANU Travel Emissions Tracker and see our emissions patterns at ANU, College and School levels.
If numbers aren’t your thing
There are other ways to incorporate carbon smart travel into your decision-making. Check out the Carbon Smart Travel guide (an updated version of the Low Carbon Travel guide) for three easy steps to reduce your carbon footprint. The guide includes action checklists and food for thought to use while planning your travel, such as:
- Considering your need to travel and what alternatives you have
- Making transport choices that reduce your carbon footprint
- Reducing your carbon footprint while travelling
The guide also gives detailed information on convenient options for when car travel is required, ways to transit between Canberra and Sydney, and other tools and resources to support your carbon smart travel.
This latest Carbon Smart Travel guide compiles advice from the ANU Travel Policy and ANU Travel Handbook, and should be read in conjunction with these documents.
Want to help shape our approach?
We are working with schools and colleges to co-design measures that support our staff in being successful with a lower travel carbon footprint. Contact the Below Zero team to contribute to our climate action program.
Want to contribute to reducing your carbon footprint in other ways?
Check out the One Small Step app, developed to speak directly to the ANU community with easy and fun ways to act more sustainably. Work is underway to incorporate the actions in the guide into the app. Head over now and start earning points by reducing your carbon footprint.